Consolidating event log and system health data into a central database is an extremely useful feature, but the wealth of data being collected can cause disk space and performance problems in small and large networks alike. This chapter will explain how to reduce the amount of data being logged by:
•Identifying top event log entries being logged (without loosing critical information)
•Suggesting performance monitoring
•Examining process tracking options
The chapter will also give recommendations on database performance optimization.
Event Log Data
It is very easy to fill up any database when consolidating all event log entries from all monitoring machines to a central database. With heavy auditing in place, it is very easy to create millions for records every day on a small network and thus bring /any database server down to its knees. As such, if you find that the EventSentry database is growing out of control, then it is important that you first identify which non-essential event log records are being consolidated, so that they can be excluded later.
To find out which events are using up most of the space, simple navigate to "Logs - Event Log" and review the default "Summary" view which shows the most active computers, event logs, sources, types etc. You may need to adapt the duration field which is set to "Last Hour" by default.
Identifying the culprit
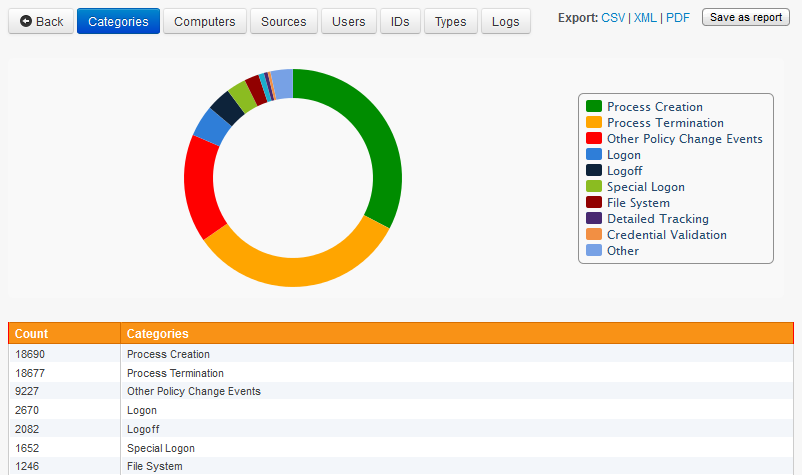
For example, to find which event categories appear most often in the EventSentry database, navigate to the EventSentry web reports and open the "Event Log" page (under Logs). Then click the blue Categories or icon next to it which yield a bar chart about all available categories. You might also want to modify the search time scope on the top right.
The left example below shows that 67% (hover over the pie chart with the mouse to see the percentage) of all events written in the last 24 hours are from the Process Creation and Process Termination category for example.
Instead of grouping events by only one dimension (categories in this case), we can also group them by a 2nd dimension - for example event ids. With the log query now restricted to only events from the security event log and audit failures, clicking the "IDs" button will yield a chart similar to the one below:
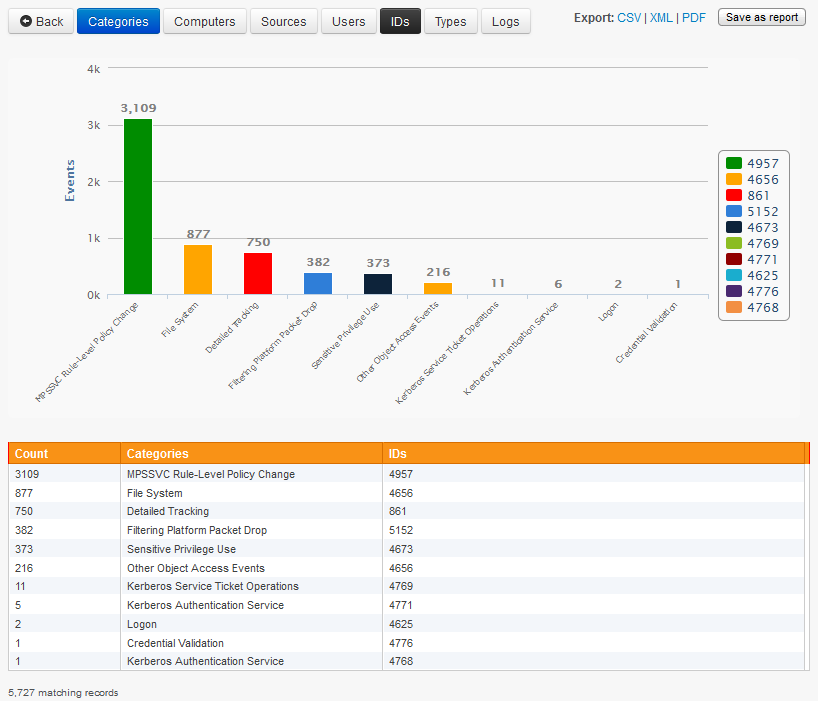
The list immediately shows which event IDs are most prevalent, and with which event category they are associated with.
Determining which events to exclude
Now that know which events use up 97% of the disk space, you can run detailed event searches to see if the events which are being logged need to be consolidated. For the first line, simply click the Reset Form button and then select the event ID 562 and the event category Object Access. When running the search, you are encouraged to limit the search results (e.g. 500 records) and also specify a time range, such as the last 24 hours for example.
Repeat this process for all events that occupy the majority of database space to determine which events can be excluded. Once you have identified events which can be excluded, setup one or more exclude filters for these events. Please consult the help file or Excluding Events in this document for more details on excluding events.
Performance Monitoring
Even though performance data uses less disk space than event log consolidation (since no event message are being logged), performance data can still fill up the EventSentry database quickly, resulting in slow queries and a large database size. Fortunately, EventSentry's performance collection feature is very flexible and you can accumulate very useful and descriptive performance data without using up too much space in the database.
When collecting counter data in the EventSentry database, we recommend that you always set the database logging interval significantly higher than the counter collection interval. EventSentry automatically calculates the average over all collected performance values over one database iteration, ensuring that the data stored in the database is very accurate.
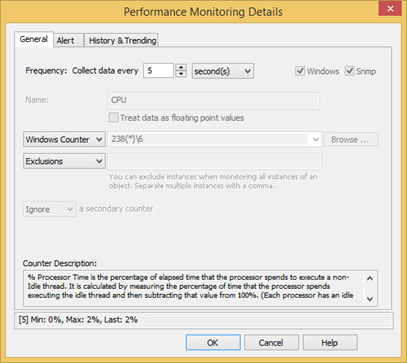
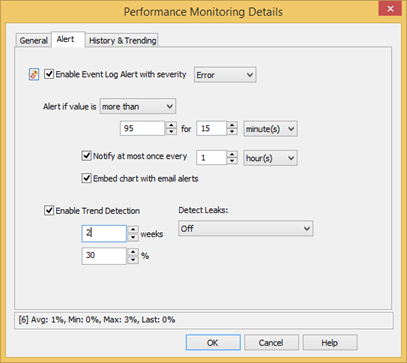
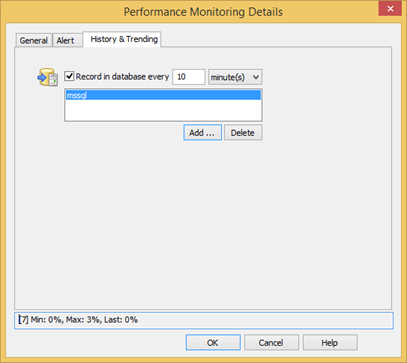
The screen shots below show a correctly configured database configuration for the Processor(*)\% Processor Time performance counter, which records the current CPU usage in percent.
Even though the CPU performance counter is queried every 5 seconds (Polling Interval), the calculated average is only written to the database every 10 minutes.
Even with this configuration that "only" logs information to the database every 10 minutes, you will get 144 data points for this counter every day. If you were to write performance counter data to the database every 5 seconds instead, then you would accumulate 17280 data points every day instead!
You might not be able to follow these suggestions if you need a more accurate picture of counter data, but you are still encouraged to make sure that the database logging interval is larger than the polling interval.
|
|
|
Process Tracking
Process Tracking data is similar to event log data, though it too uses less space in the database than event log data since no event messages are being recorded. Process Tracking can give you an enormous amount of information about the state of processes on a given server or workstation at any given time, but it can also fill up the EventSentry database quickly.
For example, many servers execute processes on a regular basis that do not need to be recorded, for example a monitoring server might execute the ping.exe process every 10 seconds, resulting in 8640 rows of data every day. We can reduce the amount of data logged by excluding unneeded information from the database.
Identifying the culprit
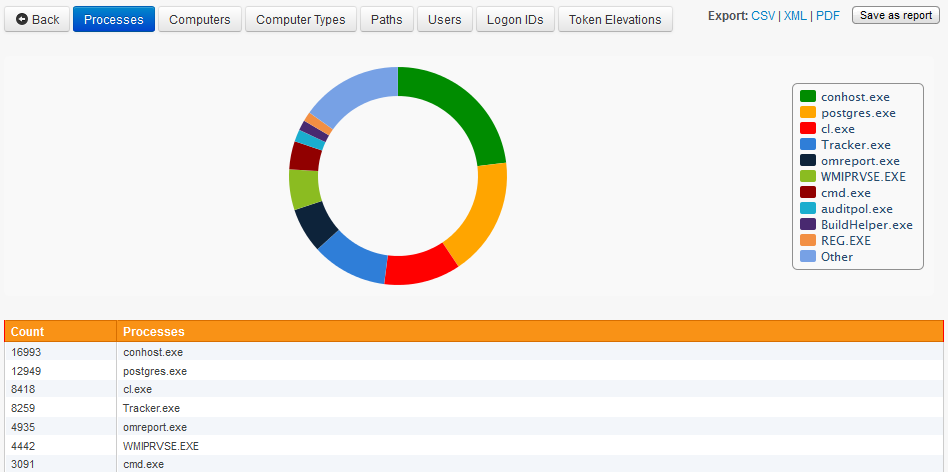
To find which process appears most often in the EventSentry database, navigate to the EventSentry web reports and open the "Processes" page (under "Compliance"). Then click the Processes header. You might also want to further restrict the search by only showing records from the last 24 hours for example.
The screenshot to the right shows that the conhost.exe, postgres.exe and cl.exe processes are being executed most often, accounting for more than 50% of the process log entries by adding approximately 40.000 rows every day.
To stop these processes from being monitored, simply exclude them in the tracking package that contains the process tracking object.
Database Optimization, Hardware Planning
If you have followed the steps above and ensured that you are only logging the data that you need to the EventSentry database, then you can tackle the next step, making sure that your database is running on the proper hardware and performing well.
It is obvious that no software can do wonders when the underlying hardware is insufficient. Please consider the following suggestions if you plan on making a hardware purchase for a new database server, or are considering a hardware upgrade for your database server. Please note that these suggestions assume that your database server will only be used for the EventSentry database.
Disk Subsystem
The disk subsystem is one of the most crucial components of a database server, if you have slow disks then your database queries will almost always be slow, even when you have ample CPU power and memory available. The ideal disk subsystem should look like this:
Number of disks |
RAID Level |
Used for |
2 x 10k or 2 x 15k SCSI |
1 (mirror) |
Operating System |
2 x 10k or 2 x 15k SCSI |
1 (mirror) |
Database Transaction Logs |
5 (or more) x 15k SCSI |
5 |
Database |
The more disks you can provide for the database partition, and the faster the disks, the better the query response time will be.
|
It is highly recommended that you put the EventSentry database on a separate partition to avoid disk defragmentation. We have seen performance improvements with disk defragmentation utilities such as Raxco's PerfectDisk® in some cases. |

Memory
The amount of memory installed is also crucial, and your database server should have at least 2Gb of memory. If you are running Microsoft SQL Server, then 4Gb or more are recommended.
CPU
The number of CPUs is not as crucial as the previous two components (one CPU should suffice in most cases), however you should still ensure that a recent CPU model (e.g. Pentium IV Xeon 2.8Ghz+) is installed.
In addition to hardware optimization, you also need to ensure that your database is optimized. Please see the Database Tips in EventSentry help manual for more information.