Capturing Traffic
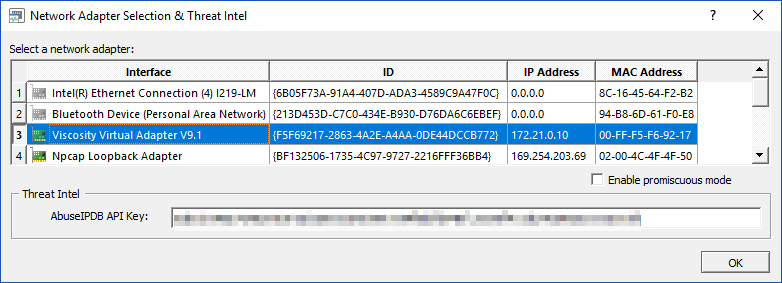
To capture traffic, click the Options button and select the interface to capture traffic on. The first interface with a valid IP address will be selected by default. As such, you will only need to manually select an interface if the computer that you are capturing on has more than one network interface with a valid IP address.
The Options dialog also allows you to enable promiscuous mode, which ensures that all packets, even when not sent to the local MAC address, are captured and displayed. If the network card is connected to a switch, then the port to which the NIC is connected to will need to be configured to forward all network traffic to this port. Most managed switches support this functionality.
Once the correct interface is selected, clicking the Start button will start capturing traffic. Once clicked, the start button will be renamed to Stop. Click Stop to suspend capturing traffic. Clicking the Stop button will not automatically clear collected information. Clicking the Clear button will erase all collected information from the display.
Threat Intel
IPMon+ can provide threat intel on all processed IP addresses in real time utilizing the OTX black list along with supplemental threat details from AbuseIPDB. Supplemental threat details are only available if an AbuseIPDB API key (free plan available as of 4/2019) is configured in the Options dialog. Checking the "Threat Intelligence" check box will enable the collection of threat intel, also checking the "Threats Only" check box will only display traffic with hosts that are deemed potentially malicious.
Filtering Traffic
|
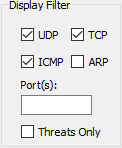
By default, all UDP, TCP, ICMP, ARP traffic statistics are displayed in the main grid window. By toggling the check boxes next to a protocol name (e.g. TCP), all traffic matching this protocol will immediately be hidden. Toggling the check boxes will not affect traffic being captured, it will only filters information from the main grid. All UDP, TCP, ICMP, ARP traffic statistics are always captured, regardless of the display filter.
You can also filter traffic based on UDP/TCP ports. Simply enter the port number in the Port(s) field, and only traffic that was sent to or from those ports will be displayed. You can specify multiple ports by separating them with a comma (e.g. 80, 443).
Threats Only Requires that "Threat Intelligence" is checked. Will only display traffic from hosts that are deemed potentially malicious.
|
Statistics
Displays how many network packets and total number of kbytes that have been captured. Changing the current filter has no effect on the statistics, which always show the overall total.
Sorting, Copy & Paste
Data in the grad can by sorted by clicking any of the column headers. Rows in the grid an be selected and copied to the clipboard by pressing the CTRL+C key combination.